Business Radar Chartui engineering
livesince 2025
For a Dutch company that supports entrepreneurs, I designed and built a custom chart library in HTML5 Canvas and JavaScript. It lets users compare their business and personal development across time, in a radial chart split into quadrants, with icons.
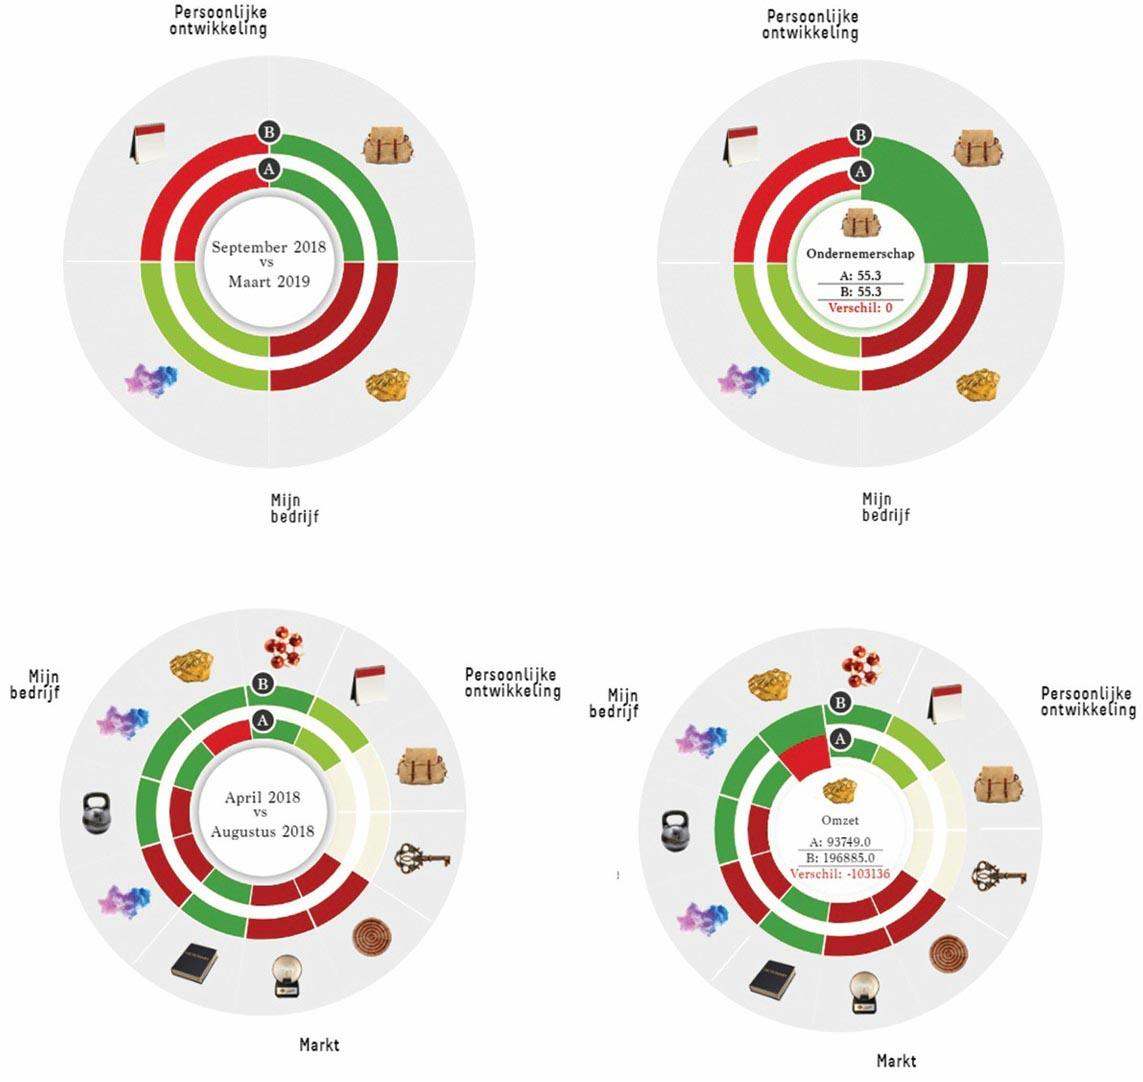
Each quadrant covers one theme: Personal Development, My Business, or Market. Each shows a before-and-after comparison for measures such as revenue, entrepreneurship and market position.
What it does
- Draws everything on canvas, with no external chart library.
- Shows each radial segment with its change in colour.
- Has tooltips that compare the two values.
- Has a timeline toggle in the centre to switch between periods.
- Uses icons so each segment is easy to read at a glance.
The company’s users can follow their growth in a clear format, which helps in coaching, mentoring and strategy reviews.
The technical challenge
The goal was a lightweight alternative to D3 or Chart.js, with no dependencies, for these custom radial charts. The solution has:
- a fast canvas rendering loop that generates the arcs
- label positioning and scaling that adjust to the data
- legend tooltips that update in real time
- a responsive layout that adapts to screen size
The result is a reusable chart module for time-based comparison dashboards built for business coaching. Each quadrant shows its category with dual-value arcs, icons, and the timeline toggle in the centre.
Where it is used
- Business coaching: tracking an entrepreneur’s progress over time.
- Personal development: showing growth in key skills.
- Market analysis: comparing market position across periods.
- Strategy reviews: presenting complex data in a readable form.
It turns business metrics into a picture of growth, so entrepreneurs can see where their business is heading and decide what to do next.
Filed under ui engineering